🪲 Debugging
Using Browser Developer Tools
Section titled “Using Browser Developer Tools”-
Make sure Live Server is running and your game is open in the browser.
-
Open the browser’s Developer Tools by pressing F12 or right-clicking on the page and selecting “Inspect”.
-
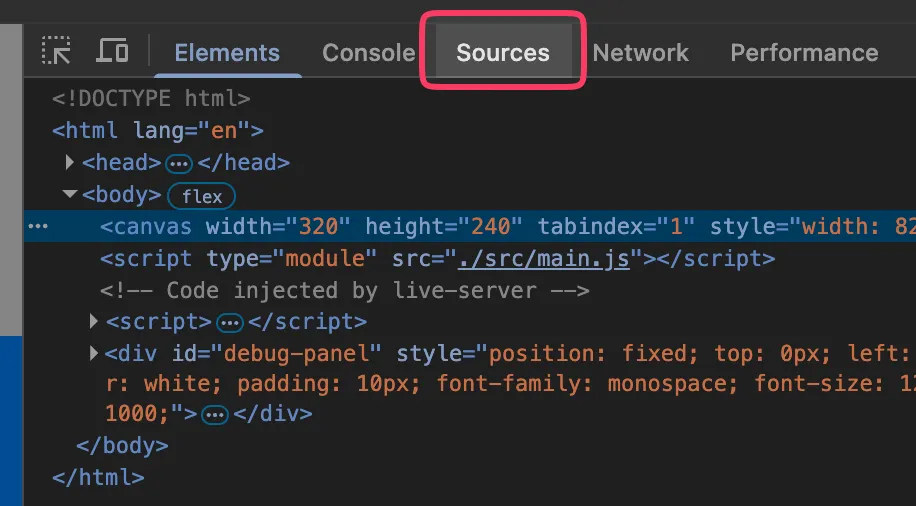
Navigate to the Sources (assuming Chrome) tab in the Developer Tools.
-
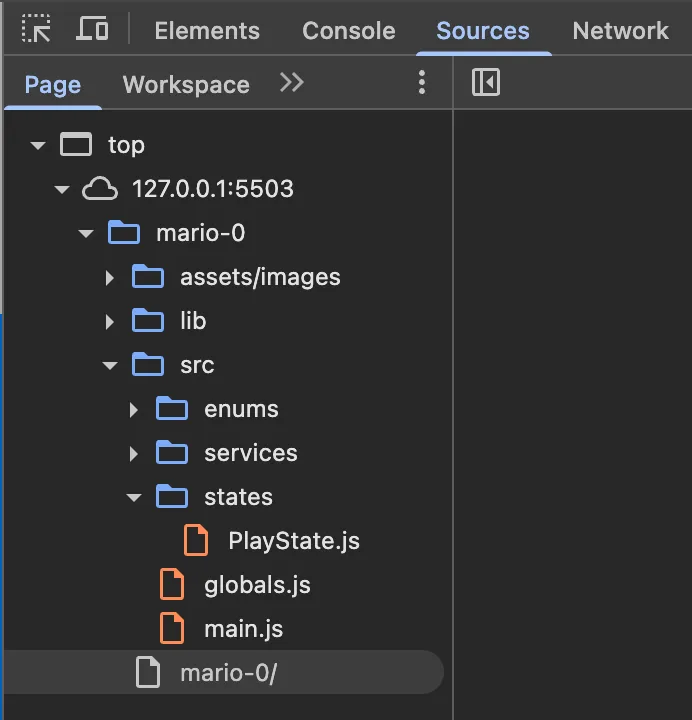
In the file explorer on the left, find and open your JavaScript files (e.g.,
main.js,Game.js, etc.).![Screenshot: File explorer in Sources tab]
-
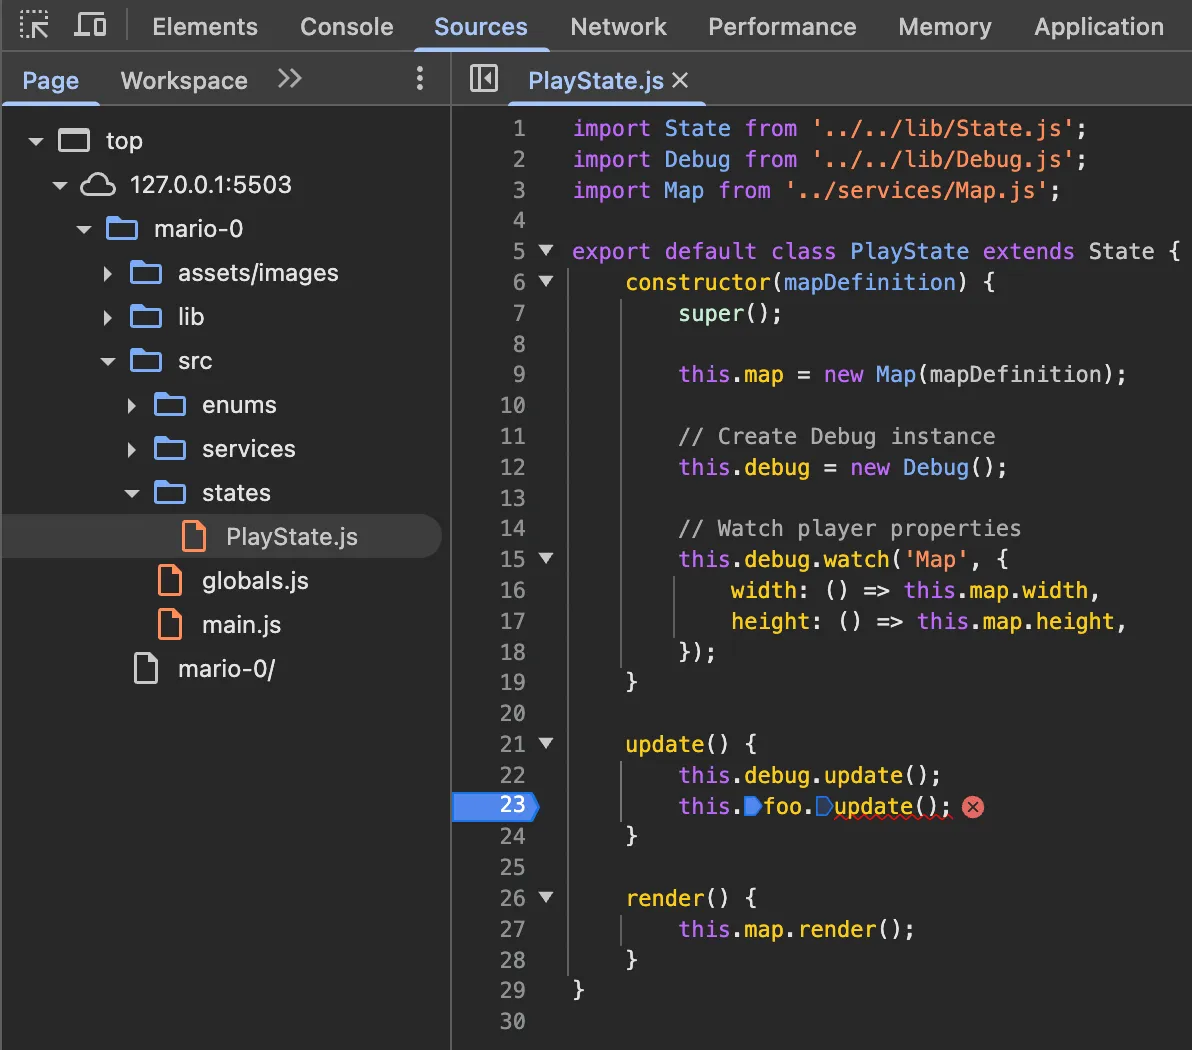
Click on the line number where you want to set a breakpoint. A blue dot will appear indicating the breakpoint is set.
-
Refresh the page or trigger the code that contains your breakpoint. The execution will pause at the breakpoint.
-
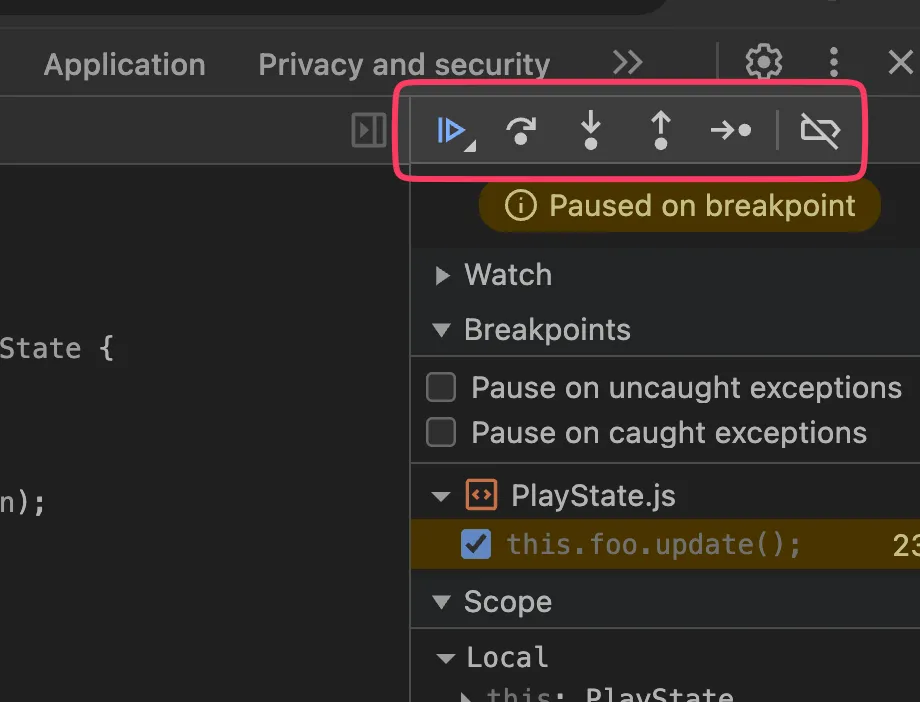
Use the debugging controls to step through your code:
- Step over (F10): Execute the current line and move to the next
- Step into (F11): Enter into function calls
- Step out (Shift+F11): Exit the current function
- Continue (F8): Resume execution until the next breakpoint
-
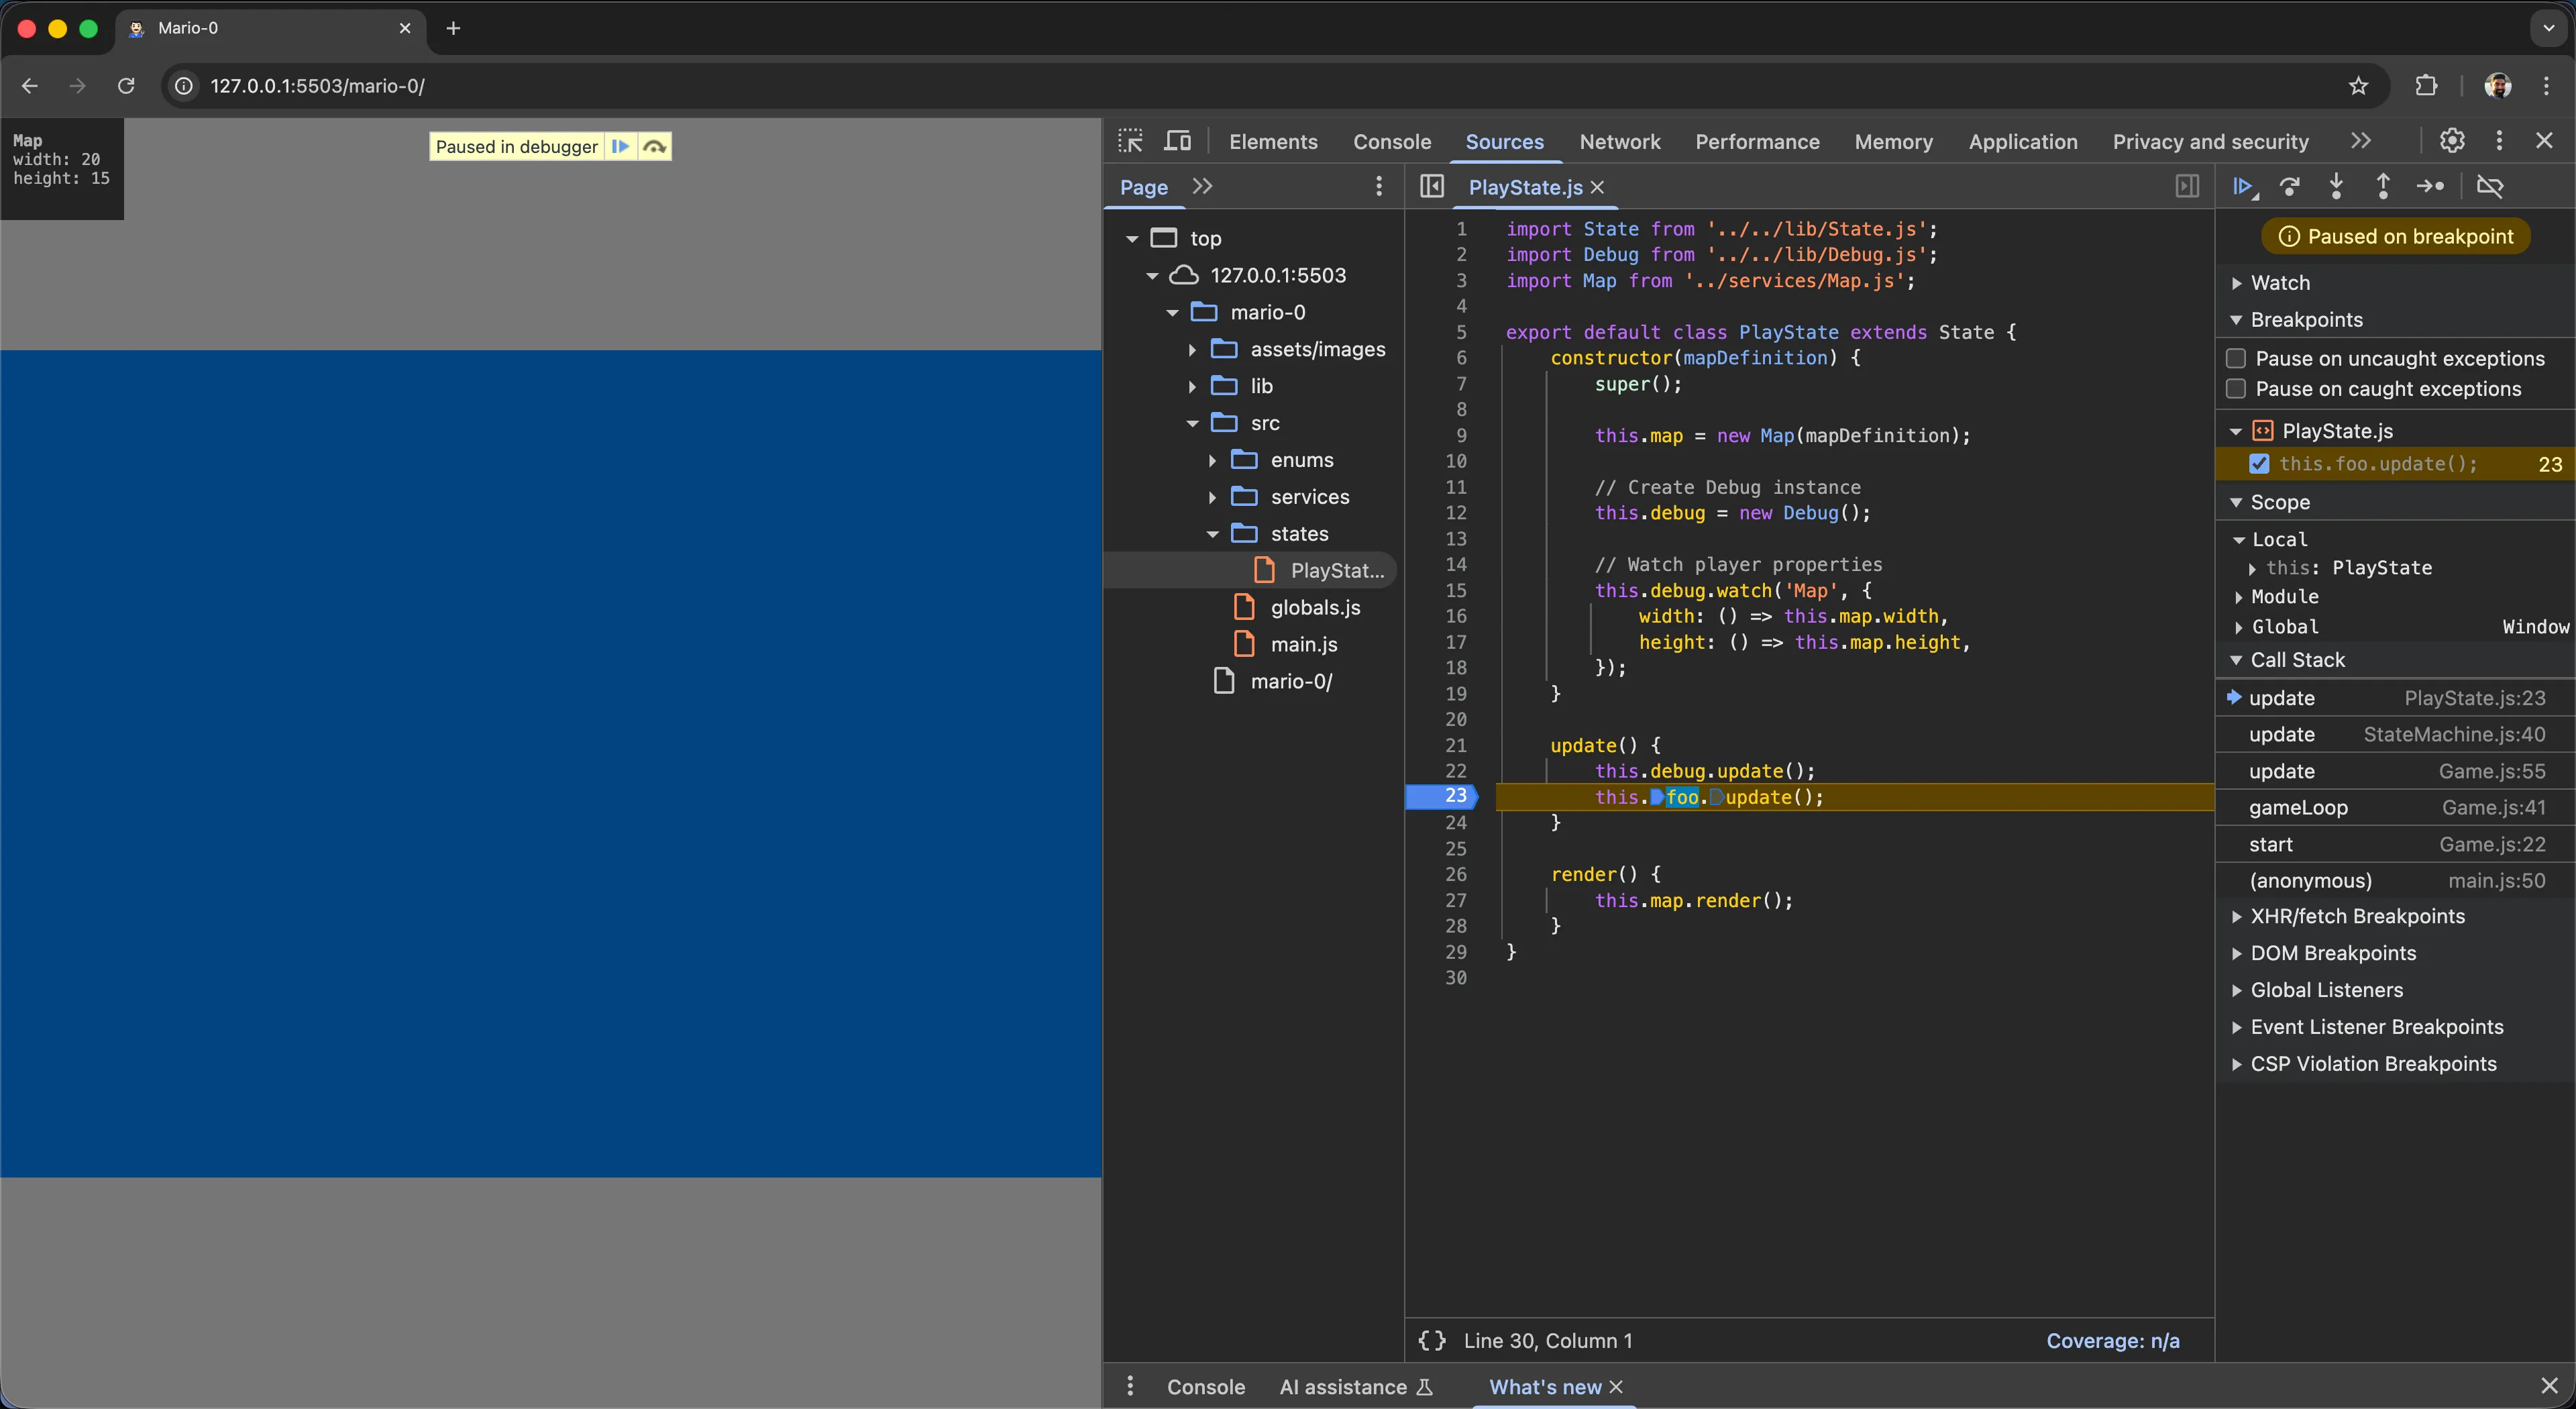
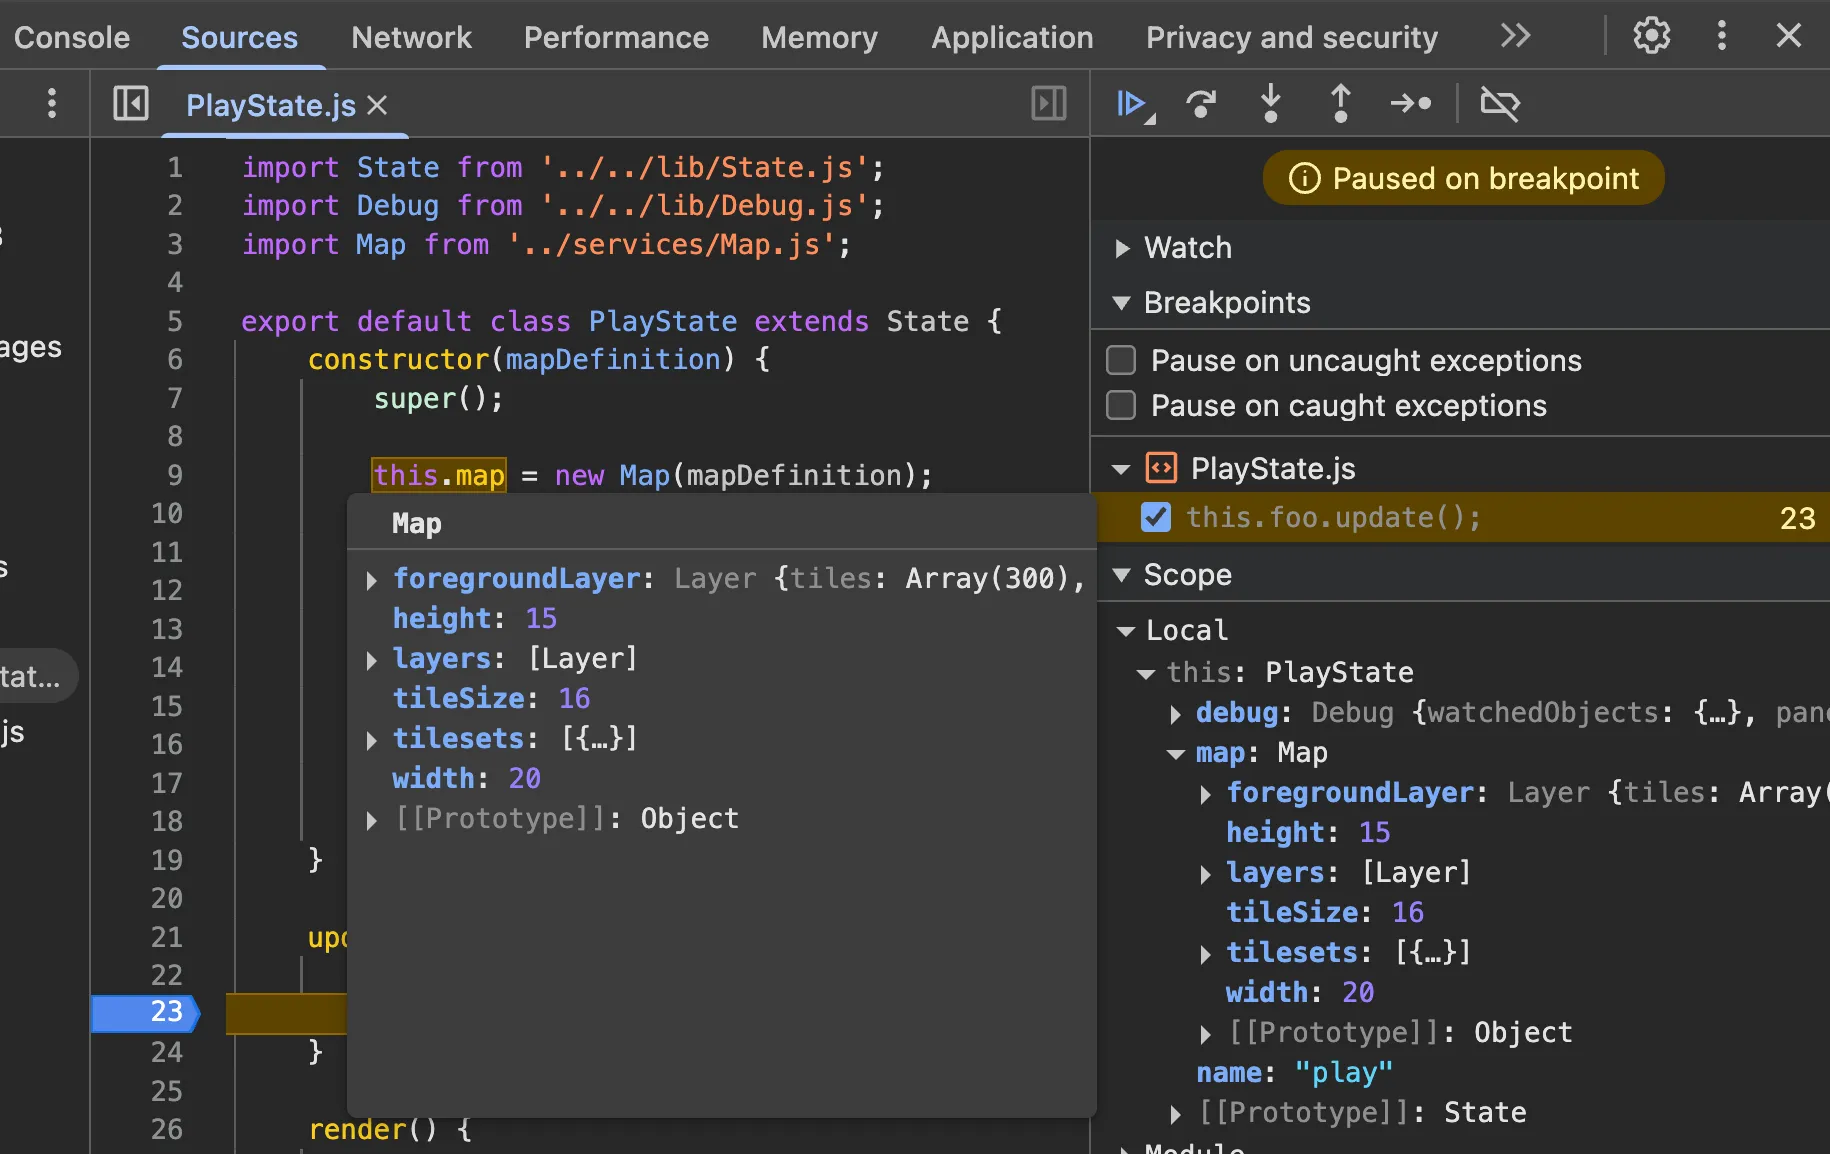
Inspect variables by hovering over them or checking the Scope panel on the right.
-
Hard code the value of
deltaTime.Game.js gameLoop(currentTime = 0) {// Calculates delta time and converts it to seconds instead of milliseconds.const deltaTime = (currentTime - this.lastTime) / 1000;const deltaTime = 0.016;this.update(deltaTime);this.lastTime = currentTime;requestAnimationFrame((time) => this.gameLoop(time));}
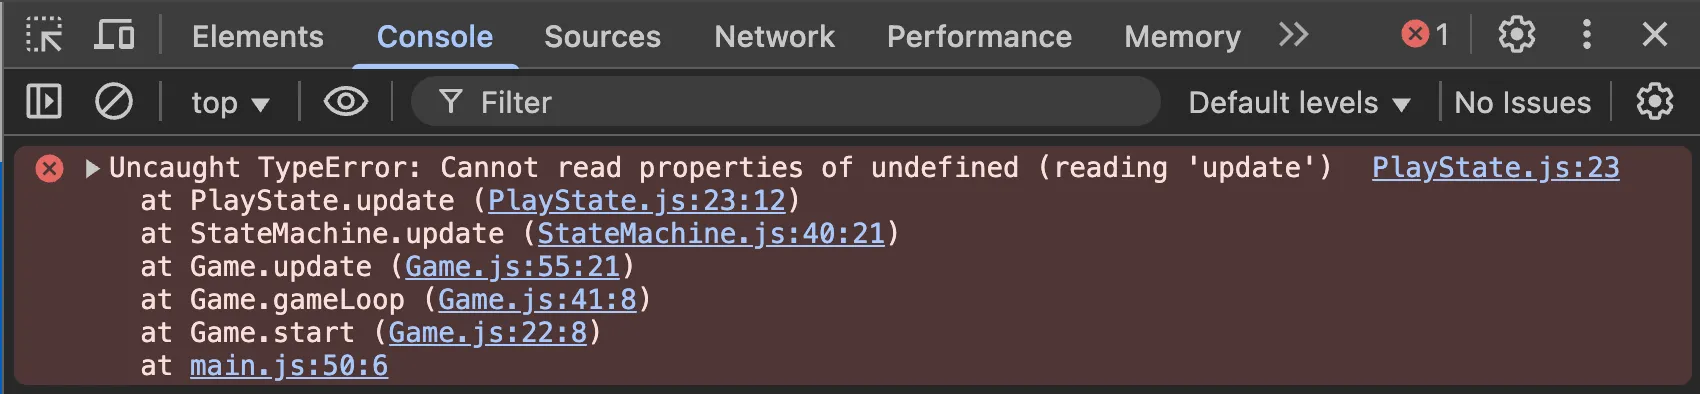
Debugging “Cannot read property ‘foo’ of undefined”
Section titled “Debugging “Cannot read property ‘foo’ of undefined””One of the most common JavaScript errors you’ll encounter is Cannot read property 'foo' of undefined (or Cannot read properties of undefined in newer browsers). This error occurs when you’re trying to access a property or method on a variable that is undefined.
Understanding the Error
Section titled “Understanding the Error”This error means that somewhere in your code, you have something like:
someObject.foo; // but someObject is undefinedThe problem isn’t with the property foo itself, but rather that someObject doesn’t exist or hasn’t been properly initialized.
Finding the Root Cause with Conditional Breakpoints
Section titled “Finding the Root Cause with Conditional Breakpoints”A powerful debugging technique is to use conditional breakpoints to catch exactly when a variable becomes undefined:
-
Right-click on the line number where the error occurs (instead of just clicking).
-
Select “Add conditional breakpoint” from the context menu.
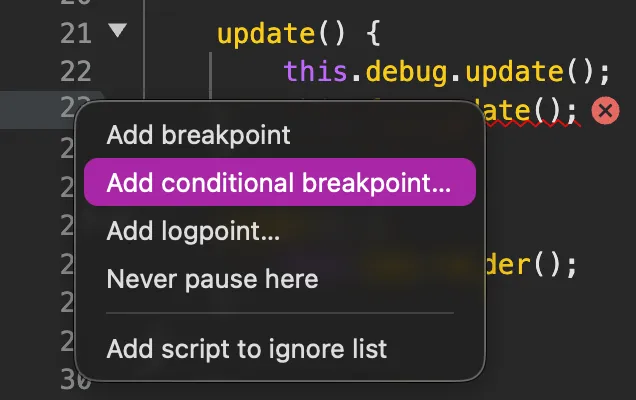
-
In the condition field, enter the condition that checks if your variable is undefined:
someObject == undefined;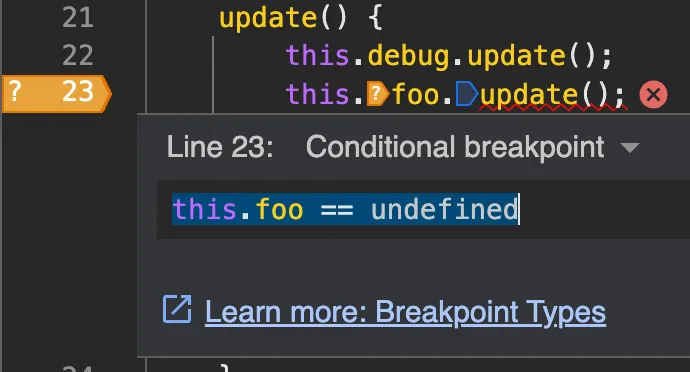
-
The breakpoint will now only trigger when
someObjectisundefined, allowing you to inspect the state right before the error occurs.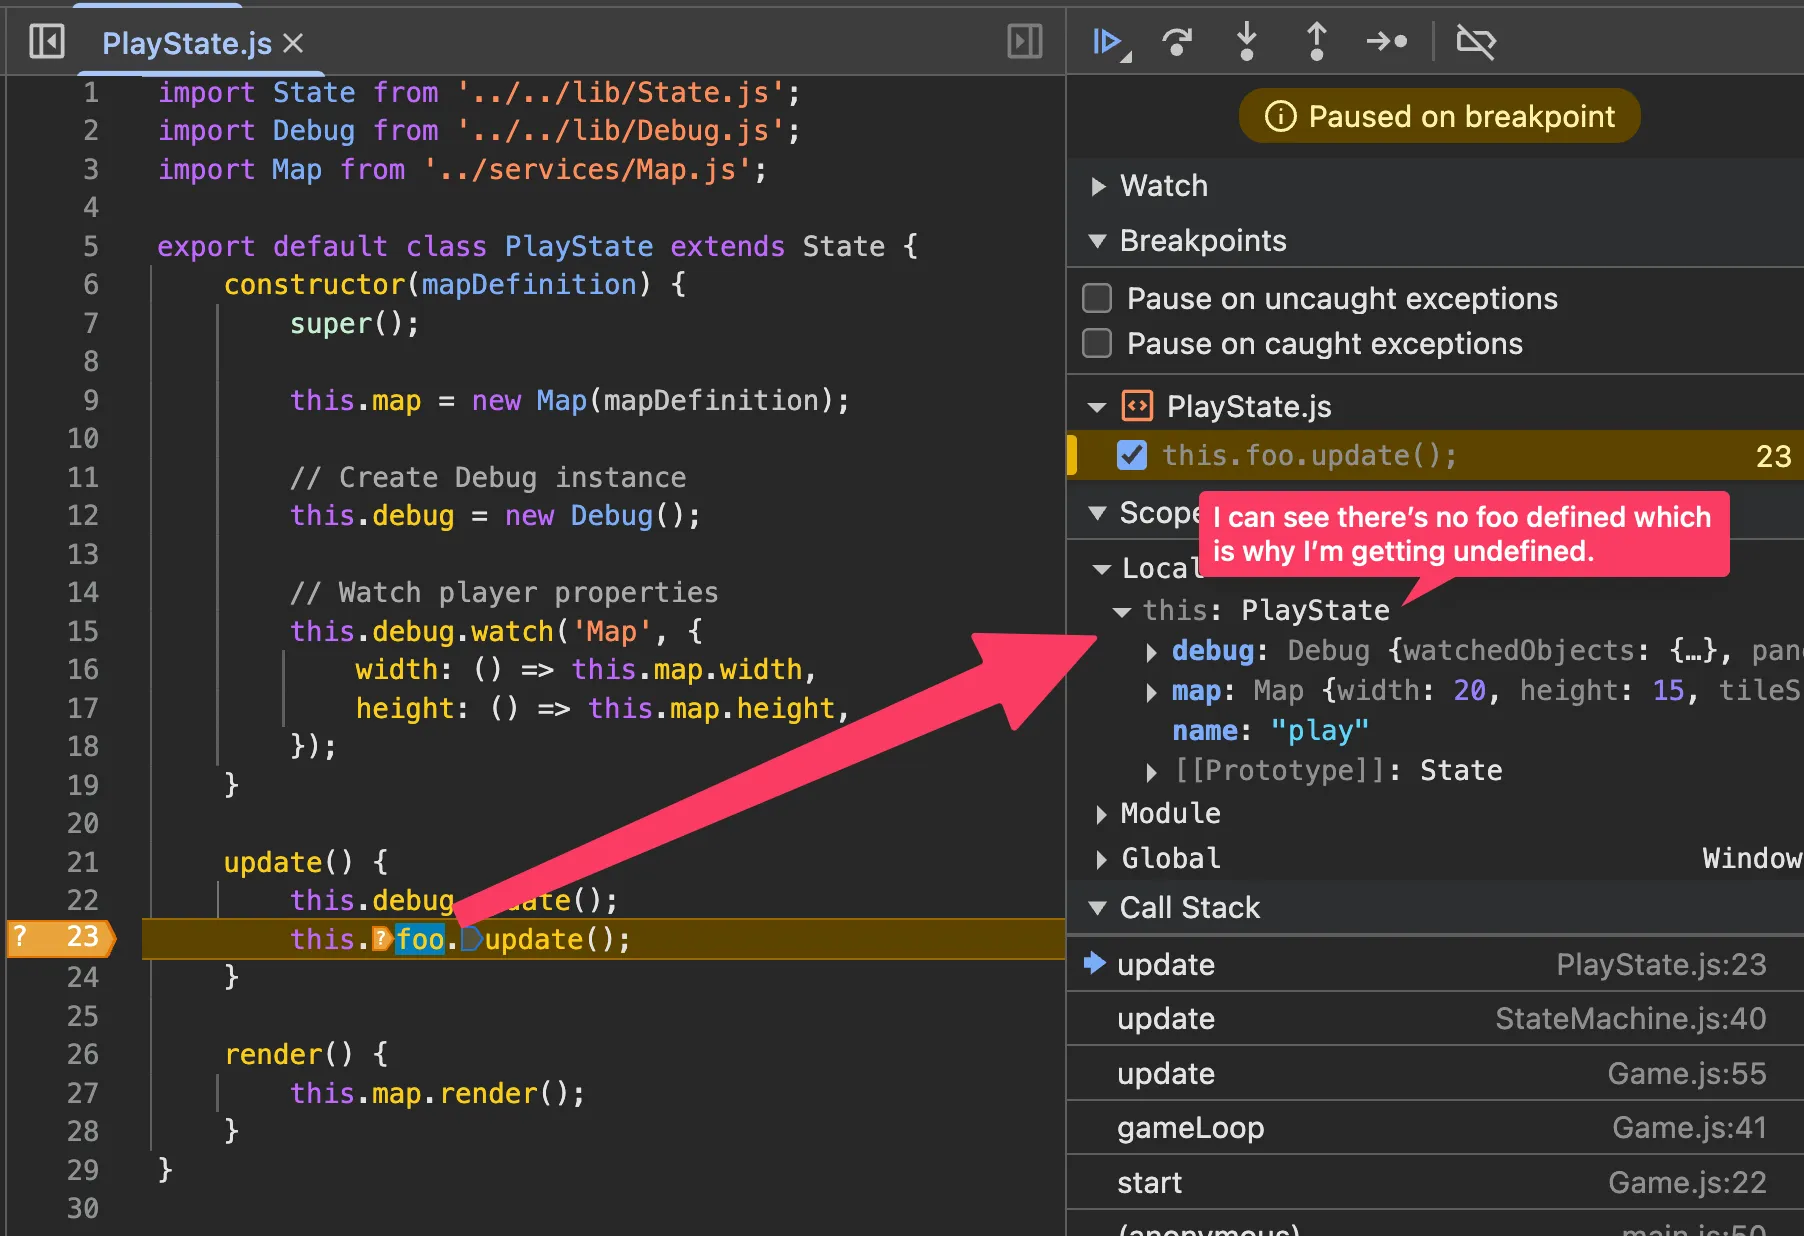
-
When the breakpoint hits, you can:
- Check the call stack to see how you got to this point
- Inspect other variables to understand why
someObjectwasn’t initialized - Step backwards through the code logic to find where the assignment should have happened
This technique is much more efficient than setting regular breakpoints everywhere, as it only stops execution when the problematic condition is actually met.
Using VS Code Global Search for Code Investigation
Section titled “Using VS Code Global Search for Code Investigation”VS Code’s global search is extremely powerful for understanding code flow and finding where things are defined, called, or instantiated. This is especially useful when debugging complex issues or trying to understand unfamiliar code.
Accessing Global Search
Section titled “Accessing Global Search”- Press Cmd+Shift+F (Mac) or Ctrl+Shift+F (Windows/Linux) to open the search panel
- Or click the magnifying glass icon in the sidebar
Common Search Patterns
Section titled “Common Search Patterns”Finding Function Calls
Section titled “Finding Function Calls”To find where a specific function is being called, search for the function name followed by parentheses:
.update(This will show you all places where the update method is called on any object.
Finding Class Instantiation
Section titled “Finding Class Instantiation”To find where objects are created, search for the new keyword followed by the class name:
new Ball(This helps you understand where and how objects are being instantiated.
Finding Property Access
Section titled “Finding Property Access”Search for property access patterns:
.position.velocity.xFinding Variable Assignments
Section titled “Finding Variable Assignments”Use the equals sign to find where variables are being set:
this.balls =gameState =Advanced Search Features
Section titled “Advanced Search Features”Case Sensitivity and Whole Word Matching
Section titled “Case Sensitivity and Whole Word Matching”- Click the Aa button to toggle case sensitivity
- Click the Ab button to match whole words only
- Click the .* button to enable regular expressions
Using Regular Expressions
Section titled “Using Regular Expressions”Enable regex mode and use patterns like:
new \w+\(This finds all object instantiations (any new SomeClass( pattern).
\.render\(.*\)This finds all calls to render methods with any parameters.
Search and Replace
Section titled “Search and Replace”Use Cmd+Shift+H (Mac) or Ctrl+Shift+H (Windows/Linux) to open search and replace, useful for:
- Renaming variables across multiple files
- Updating function signatures
- Changing property names consistently
Practical Debugging Workflow
Section titled “Practical Debugging Workflow”- Error occurs: “Cannot read property ‘x’ of undefined”
- Global search: Search for
.xto see all places where this property is accessed - Narrow down: Look at the search results to find the problematic line
- Trace back: Search for where the object should have been created (
new ObjectName() - Follow the flow: Search for the variable assignments leading up to the error
This approach helps you quickly navigate through large codebases and understand the relationships between different parts of your code